Web UI
Remind includes a web interface for exploring and managing your memory database.
Quick start
remind uiThis starts the server and opens your browser with the project-local database selected. For a specific port:
remind ui --port 9000
remind ui --no-open    # Start server without opening browser
You can also access the UI when the MCP server is running:
http://localhost:8765/ui/?db=my-projectViews
Dashboard
Overview of memory statistics: episode count, concept count, entity count, consolidation status, and episode type distribution.
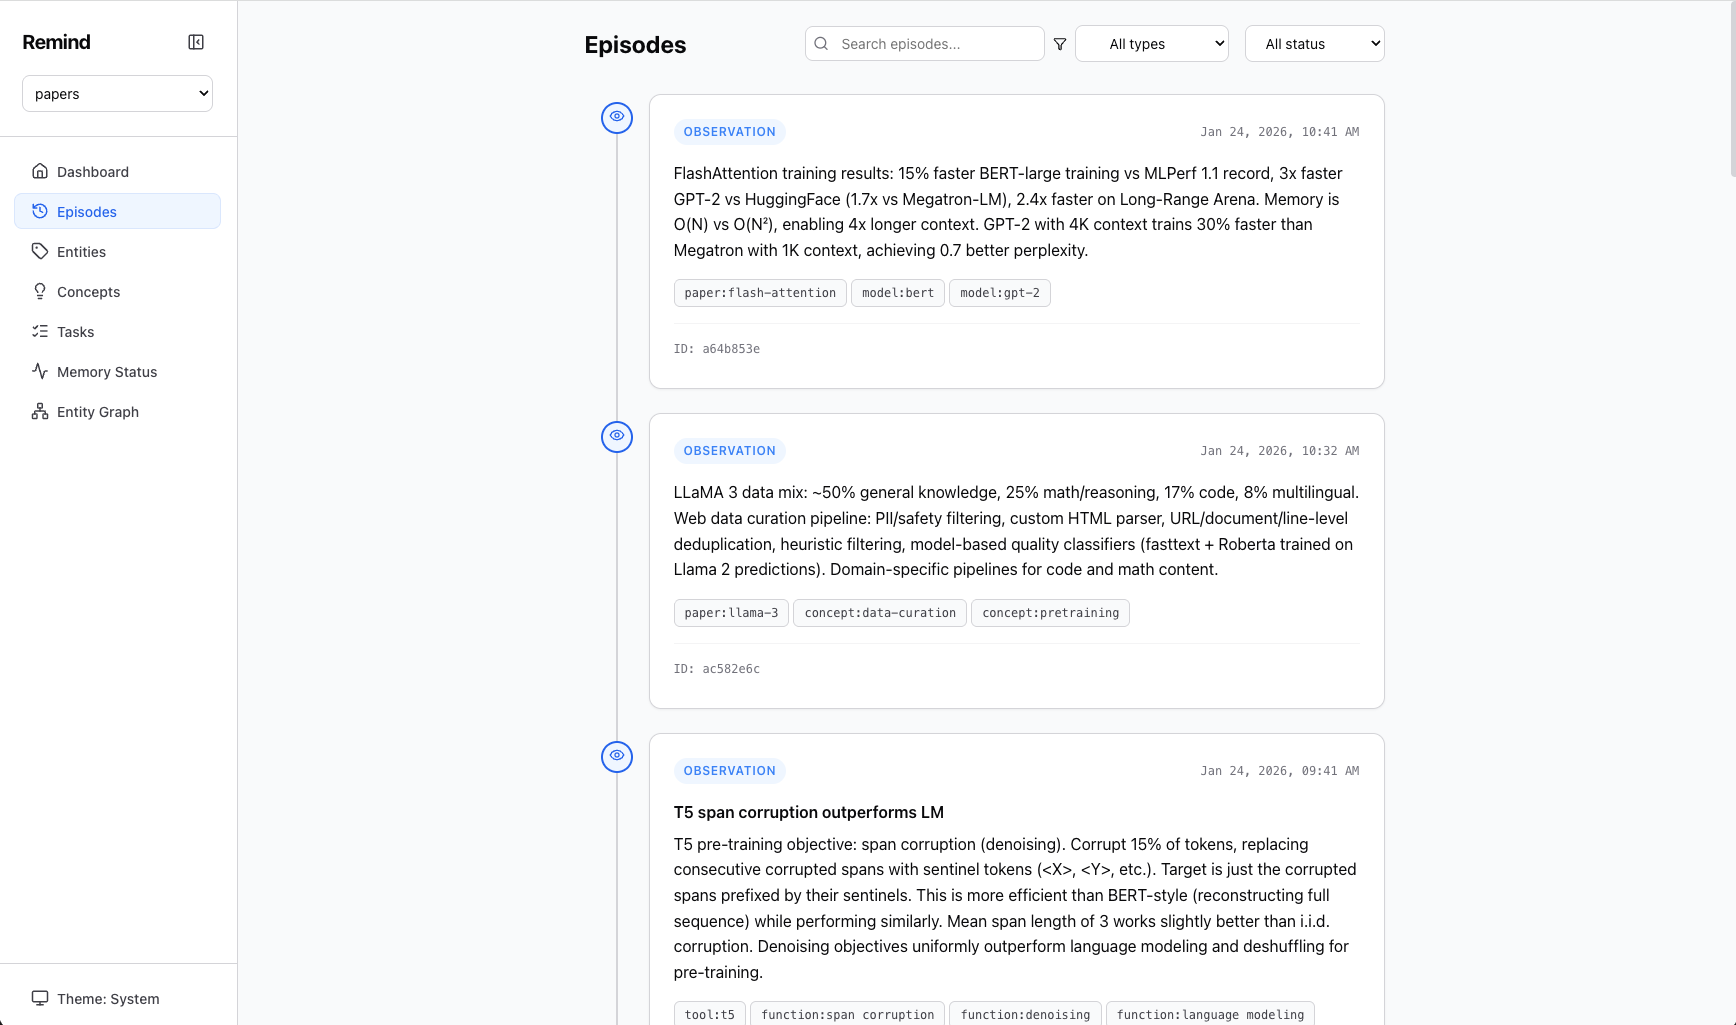
Episodes
Timeline view of raw experiences. Filter by episode type (observation, decision, question, meta, preference, outcome, fact). Inline delete for cleanup.
Concepts
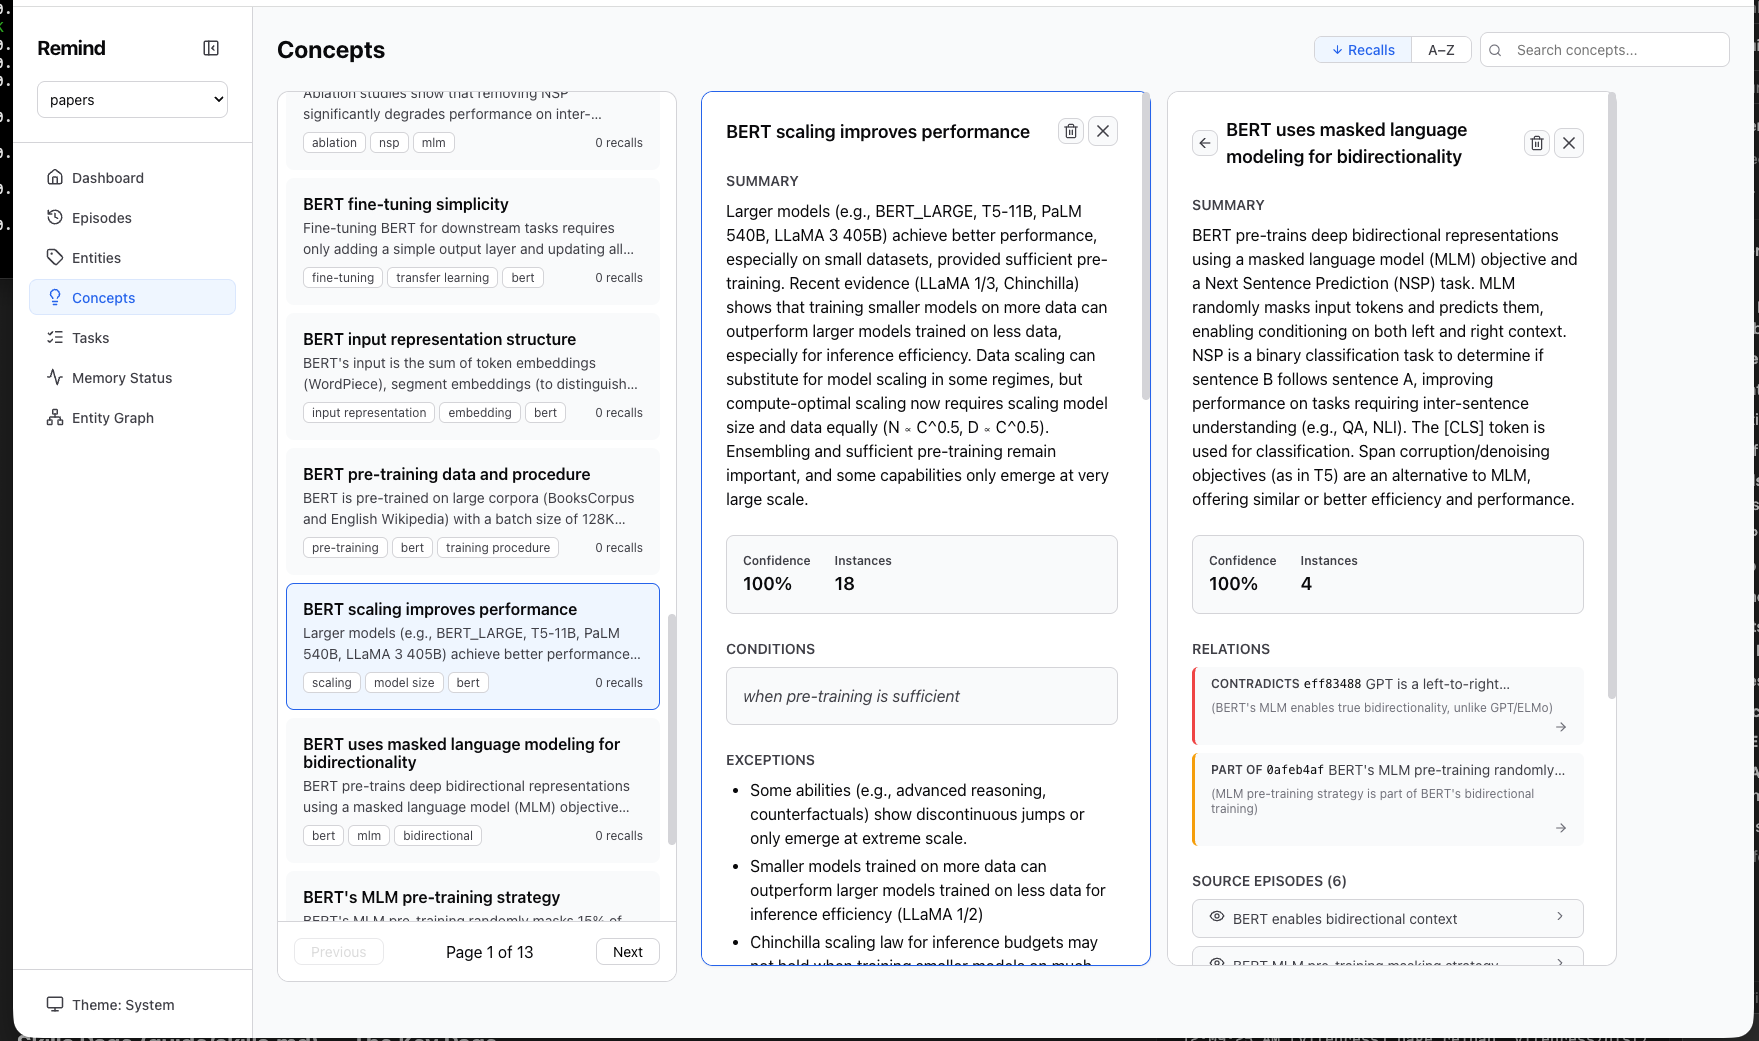
Browse generalized concepts with confidence scores, instance counts, and relations. Search by keyword. Click a concept to see its full summary, conditions, exceptions, relations, and source episodes.
Concept Types
Concepts display a type badge indicating their category:
- Pattern (purple badge) — Generalized knowledge abstracted from multiple episodes
- Facts (gray badge) — Clusters of related facts, preserved verbatim
- No badge — Legacy concepts created before dual-track
For fact clusters, the detail view shows:
- Active facts with provenance (who asserted, since when)
- A collapsible history of superseded facts with their validity windows
- Conflict warnings if contradictory facts are detected
Conflicts
An inbox for triaging detected contradictions, with an open-count badge in the sidebar. Fact conflicts show both competing statements side by side with provenance — "Keep this" resolves the conflict, structurally superseding the losing fact. Concept conflicts link to the involved concepts. Optional resolution note and "decided by" fields; resolved and dismissed history in separate tabs. See Facts & Conflicts.
Entities
Explore entities (files, people, tools, concepts) and their mention counts. Click through to see related episodes and concepts.
Graph
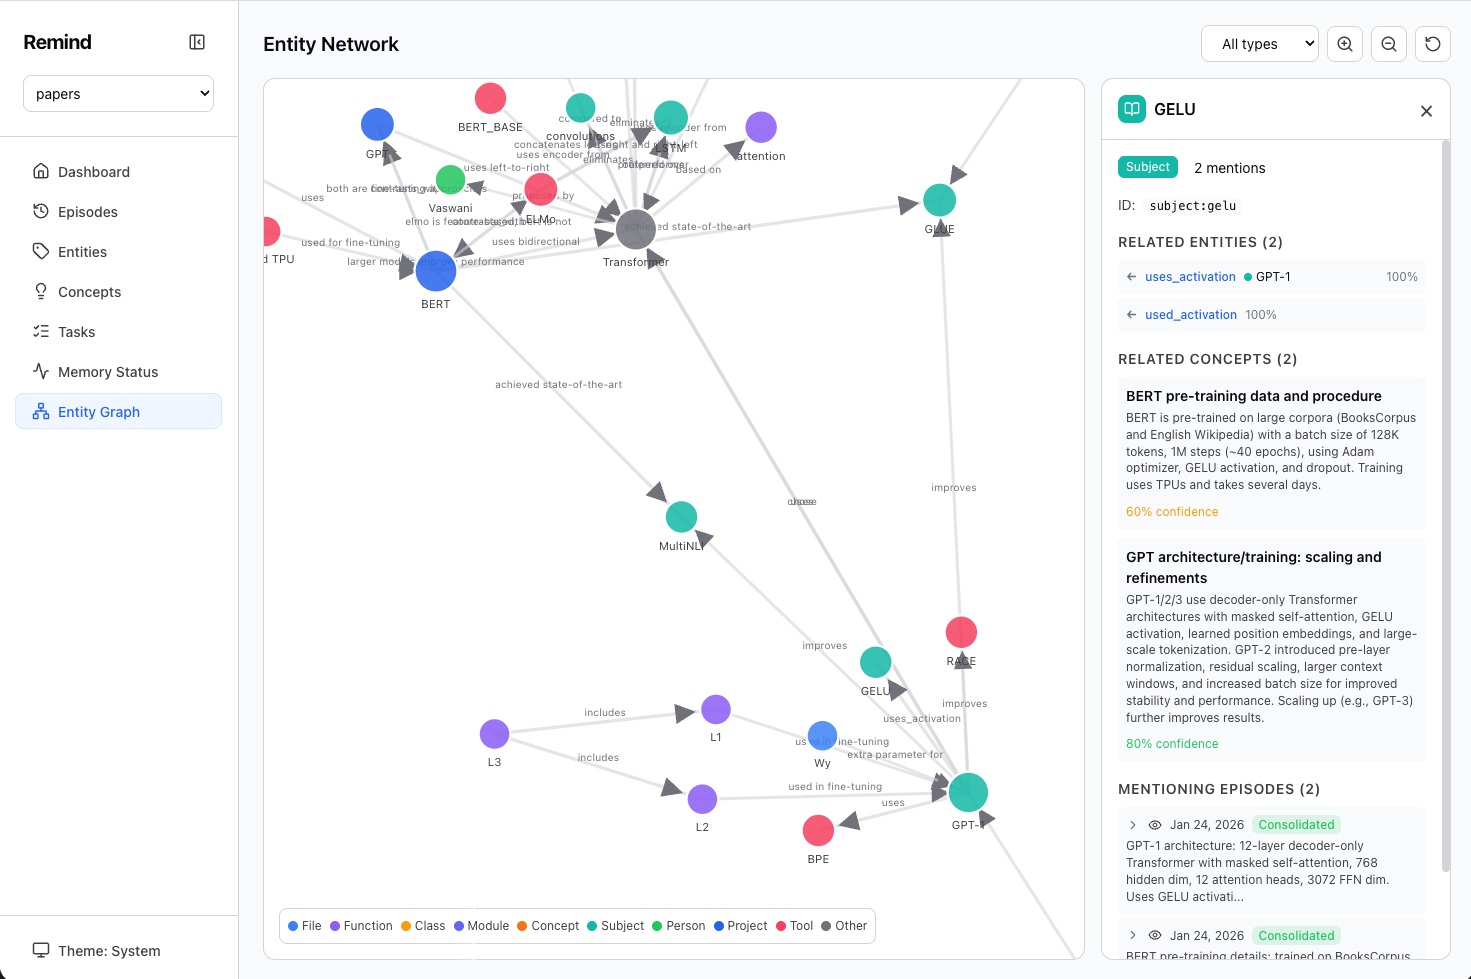
Interactive D3 visualization of the entity network. Zoom, pan, and click nodes to see details. Relations are shown as directed edges with typed labels. Nodes are color-coded by entity type.
Memory Status
Memory health dashboard showing decay statistics, consolidation state, and database metrics.
Features
- Database selector — Switch between multiple databases from the sidebar
- Dark mode — Toggle between light, dark, and system theme
- Collapsible sidebar — More space when you need it